The Moon█ OVERVIEW
The Moon is a script that is designed to help Traders analyse their charts using the moon. This script consists of three main features :
1. Moon Phases Pro : This is a more powerful version of the default built-in Moon Phases where it would plot both past cycles and Future cycles with a better accuracy.
2. Moon Lines : This plots the moon's longitude into price. you can also select your desired $/degree ( price vs time unit) to make these lines better suited for your chart and the asset your playing with. We also didn't forget to add an option to enable harmonics of these lines. In addition, you can select "reverse" to get the downtrending plants as well.
3. Moon Angles : This allows you to highlight areas where the moon is at X degree. you can get the Moon at zero aris or 180 degrees or any other degree!.
We also added some styling options to help with the visuals.
█ Future Plans and upgrades to this script may include :
1. Enhanced algorithm for a faster loading/processing script.
2. More future dates plotting.
And more! Feel free to contact me with any feature that you would like to see in this script
█ How to use :
1. Open the settings.
2. Enable your desired tool and adjust the settings.
Give the script a few seconds and you should be set. Don't enable more than 2 tools at the same time, but if you want to do that, you can insert the same script twice or more in your chart.
This script is coded as an addon to the Gann ToolBox package/scripts.
Cari skrip untuk "Moon Phases"

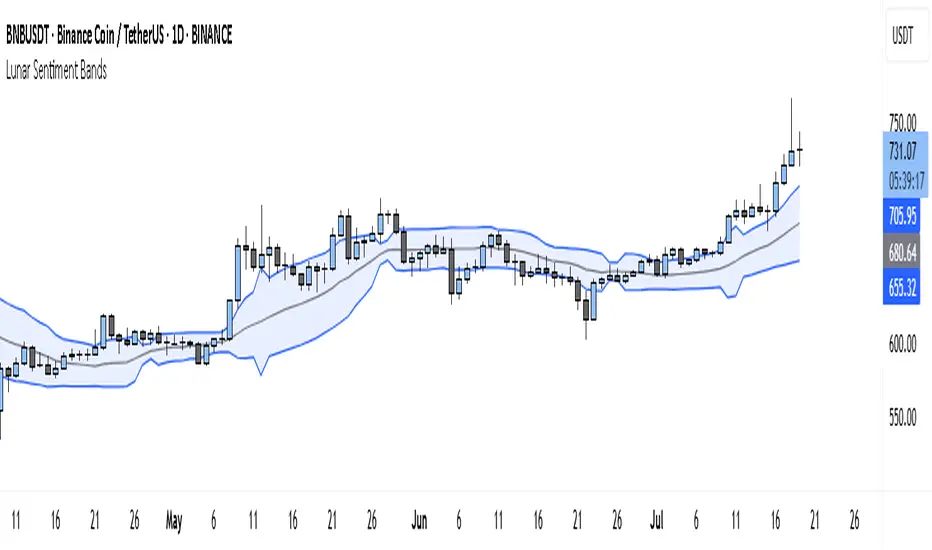
Lunar Sentiment BandsThe Lunar Sentiment Bands indicator is designed to combine simple price volatility analysis with the timing of moon phases. It's based on a moving average and two bands above and below it—similar to Bollinger Bands. But unlike regular bands, the width of these adjusts dynamically depending on two key conditions: the moon phase and market volume.
Around Full Moons, markets often show emotional or volatile behavior. If there's also a surge in trading volume during that time, the indicator automatically expands the bands. This tells you the market might be gearing up for a breakout or high-energy move.
Around New Moons, things are typically quieter. If there’s no significant volume, the indicator contracts the bands. This reflects a calmer environment or a potential “coil” where price is building up energy.
Traders can use this shifting bandwidth to guide decisions. Wide bands suggest breakout potential—either to join the move or to stand back until direction becomes clearer. Narrow bands suggest you may want to trade reversals, or simply wait for volatility to return before entering a position.
This approach doesn't try to predict direction. Instead, it gives you a sense of when the market is most likely to become active or stay quiet, using the rhythm of the moon and real-time volume to shape that view.
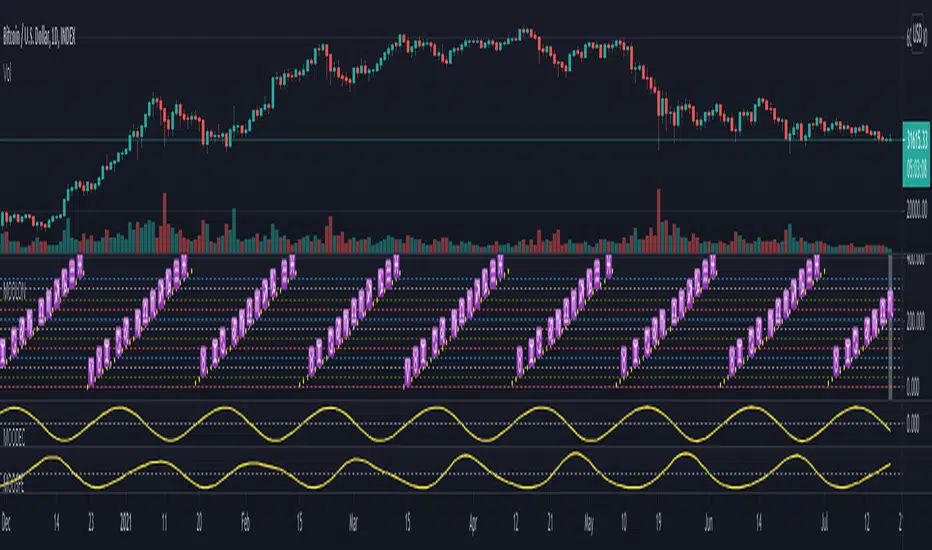
Financial Astrology Moon LongitudeMoon energy represent the masses, crowds, public places, children and emotions. The transit of the Moon through the zodiacal signs will color the crowd emotional responses that fluctuate based on the elemental qualities of the signs: fire (energetic and impulsive), earth (rigid, static, patient), water (assimilation, transformation, humor fluctuations), air (expansion, fervent, germination).
The daily average speed of the Moon is 13 degrees, for this reason the emotional elemental energy is transforming in average every 2 days and few hours, this mood fluctuations produces the short term instinctive and emotional actions performed by traders that forget the precise mathematical / statistical approach in favor of irrational and emotional impulses.
Based on statistical buy/sell frequency analysis we discovered that for BTC-USD, the Moon is usually bullish in zodiac signs: Aries, Libra, Scorpio, Aquarius and Pisces, the most relevant bullish sign is "Aquarius", from 206 observations in all the BTC-USD price history where Moon was in this sign the 60% of those days the price increased compared to the previous day. The bearish zodiac signs for BTC-USD are: Taurus, Cancer, Leo, Sagittarius and Capricorn, the most relevant bearish sign is "Capricorn".
Interestingly this zodiac sign locations tends to fluctuate during some periods of time and from the last 10 observations of the Moon transiting through Aries we noted that 7 of the 10 observations coincide with a dip, sometimes the Moon in Aries indicate the reversal of the short term trend, this is kind of expected considering that when Moon approaches Taurus the fall becomes more likely due to the fact that Moon in Taurus is a bearish signal.
With this indicator there is unlimited possibilities to explore across different markets and complementing with Moon phases this may be the perfect financial astrology indicator for those intraday traders that keep positions only for few hours.
We encourage you to analyze the Moon zodiac sign cycles in different markets and share with us your observations, leave us a comment with your research outcomes. Happy trading!
Note: The Moon longitude indicator is based on an ephemeris array that covers years 2010 to 2030, prior or after this years the longitude is not available, this daily ephemeris are based on UTC time so in order to align properly with the price bars times you should set UTC as your chart reference timezone.
Astro Trading Strategy by LansTitle:
Astro Trading Strategy + Planetary Dashboard + Future Forecast
Description:
This strategy combines astrology-inspired market timing with automated trade entries. It uses planetary cycles, moon phases, and zodiac transitions to generate Buy and Caution signals, helping traders align with key cosmic events.
🪐 Key Features
Planetary Dashboard – Displays current Zodiac sign, Moon phase, and planetary conditions in real-time.
Moon-Phase Trading – Generates Buy signals on New Moons and Caution signals on Full Moons (configurable).
Mercury Retrograde Filter – Optionally avoids trading during Mercury Retrograde periods.
Planetary Aspect Filter – Trades only when favorable Venus conjunctions align and Saturn squares are avoided.
Future Forecasting – Calculates and displays the next upcoming Buy and Caution days directly on the chart.
Fully Configurable – Enable/disable dashboard, aspect filters, and moon-phase logic to fit your trading style.
🎯 How It Works
Buy Signals appear during supportive cosmic alignments (e.g., Venus conjunct Sun + New Moon).
Caution Signals appear near Full Moons, Saturn squares, or Mercury retrogrades.
Automated Entries – When enabled, strategy takes trades based on signal conditions for backtesting.
⚠ Disclaimer
This is an experimental astro-financial strategy intended for educational purposes. Past planetary patterns do not guarantee future performance. Always combine with sound risk management and technical confirmation before trading live markets.
---
#astrotrading #planetarycycles #moonphases #strategy #astrology #swingtrading #backtest

Kootch Moon Phase Strategy🌙 Moon Phases Equity Strategy
This strategy explores the relationship between lunar cycles and equity price action.
It is based on a simple idea: markets may respond differently around New Moons and Full Moons.
🛠 How it works
• New Moon → Long Entry
The strategy enters a long position at the first bar after a New Moon event.
• Full Moon → Exit
The strategy closes the long position at the first bar after the following Full Moon.
• Optional Filters
• 200-day Moving Average (on by default): only take longs in bullish regimes.
• ATR-based Stops & Targets: risk management can be added with configurable multiples of ATR.
• Minimum Gap: ensures a cooldown period between trades to avoid clustering.
• Position Sizing: by default, trades risk a configurable % of equity (set to 35%).
📊 Notes
• This script is designed for equities (stocks, ETFs).
• It is a long-only system by default. If you enable “Always Flip,” the script will alternate long/short each lunar phase, but that is more experimental.
• Results can vary widely depending on the underlying asset. Trending stocks (e.g., AMZN, AAPL, SPY) tend to perform better with the long-only mode.
• Risk/Reward tracking in R-multiples is included for more consistent performance evaluation.
⚠️ Disclaimer
This strategy is for educational and research purposes only. It does not guarantee profitability and should not be used as financial advice. Past performance does not indicate future results. Always backtest on your preferred instruments and use sound risk management.

Gamification IndicatorDo you want your charts to look like a video game? Look no further! Would you rather be an alien racing through a lava tube, a surfer with great white sharks, an airplane flying through the clouds, or some other custom emoji setup of your choice? Traders can choose their own custom player emoji, trend indicator, obstacle emoji, and celestial emoji. This indicator is just for fun and is not intended to be used when making trading decisions. Enjoy!
This indicator also contains a live sun/moon emoji that should accurately reflect day/night and can give information about the current moon phases.
Shoutout to @citlacom for the public Moon Ephemeris and calculations. Building this indicator was a useful & fun introduction to financial astrology in Pinescript.

Lunar Cycles Projected Forward; Moon phases into futureProjecting Lunar Cycles/ half-cycles forward in time
User sets the recent Full moon in history to anchor from; Indicator projects 1/2 cycles forward in time
//inputs//
-input number of full lunar cycles to project forward from input full moon time
-choose color/opacity/border color/text display

mix indicator「ALL」+ FiblineFibline
Detect highs and lows and write Fibonacci automatically
高値と安値を検出し、自動でFibonacciを書きます。
-------------------------------------------------------
Moon phases 2020 for Japan
月の満ち欠け 2020年度 日本向け
Full Moon is Purple line
満月は紫色
New Moon is Red line
新月は赤色
ーーーーーーーーーーーーーーーー
Planet orbit cycle Line
惑星の公転周期
Bulu Line : MERCUR
青:水星
Yellow Line : VENUS
黄色:金星
Green Line : EARTH
緑:地球
Orange Line : MSRS
オレンジ:火星
A line that divides one lap into four
1周を4分割したライン
ーーーーーーーーーーーーーーーー
EMA、SMA period can be set
Background used KDJ、SMA logic
When the background is green, there is a chance to buy and when it is red, there is a chance to sell
複数のEMA、SMAを表示できます。
EMA、SMAの期間が設定でき、表示/非表示の設定も可能です。
背景にはKDJのロジックを使用しています。
背景が緑色の時は買いのチャンスで、赤色の時は売りのチャンスです
------------------------------------------
BB + itimoku

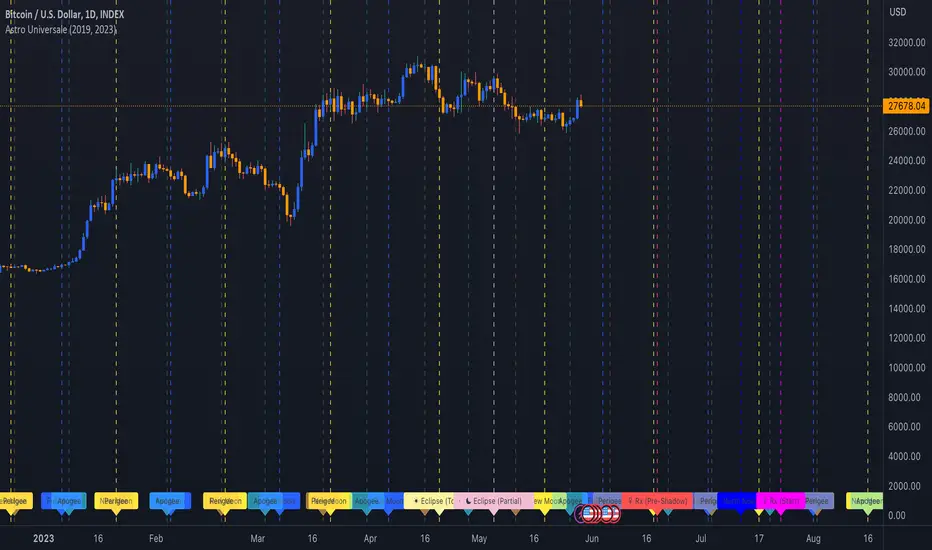
Astro UniversaleSolar Eclipses (Annular, Partial, Total), Lunar Eclipses (Penumbral, Partial, Total), Venus (including shadow periods), Moon Phases, Apogees, Perigees, and the North Node from 2013 to 2024... The dates might vary by one day depending on your location because of differences in time zones.
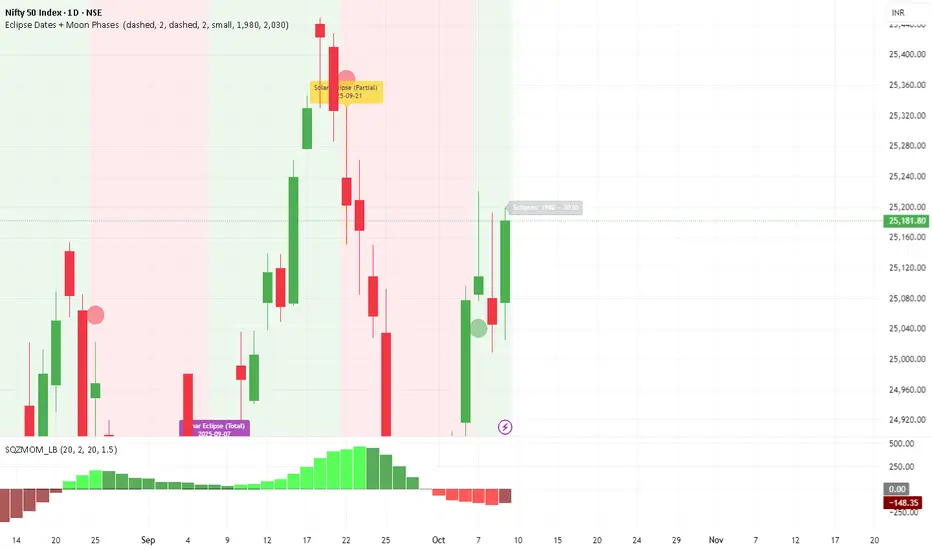
Breakout Indicator + OB & FVG📈 Breakout Indicator + OB & FVG
This script is designed to assist with identifying potential breakout zones following periods of low volatility or price consolidation. It integrates price structure analysis with optional lunar phase filtering for enhanced visual insights.
🔍 Key Features
Consolidation Detection: Automatically identifies price ranges with low volatility over a user-defined lookback period.
Breakout Signals: Highlights potential breakout zones when price moves beyond consolidation range highs or lows.
Take-Profit & Stop-Loss Levels: Automatically calculates three TP levels and one SL level based on user-defined multipliers.
Lunar Filter (Optional): Applies a visual overlay during full moon phases as a unique experimental timing filter.
Visual Elements:
Entry/TP/SL levels shown on chart with colored lines and labels.
Consolidation zones shaded with customizable colors.
Dynamic panel with volatility metrics and last signal info.
⚙️ Inputs & Customization
Adjustable lookback period, volatility threshold, and risk multipliers.
Optional lunar phase aggression multiplier.
Full customization of zone colors, label visibility, and transparency.
📌 Disclaimer
This indicator is a visual tool for analysis and does not provide financial advice or guaranteed outcomes. Its purpose is to support discretionary decision-making, not replace it. Past signals do not guarantee future performance. Always test tools thoroughly and use appropriate risk management.
🧠 Developer Notes
Based on simple volatility and price action mechanics.
The lunar filter is symbolic and not based on real astronomical data.
No repainting or future leaks; signals are generated based on confirmed candle closes.

